INTRODUCTION TO FOREX
The world's largest financial market
Beginner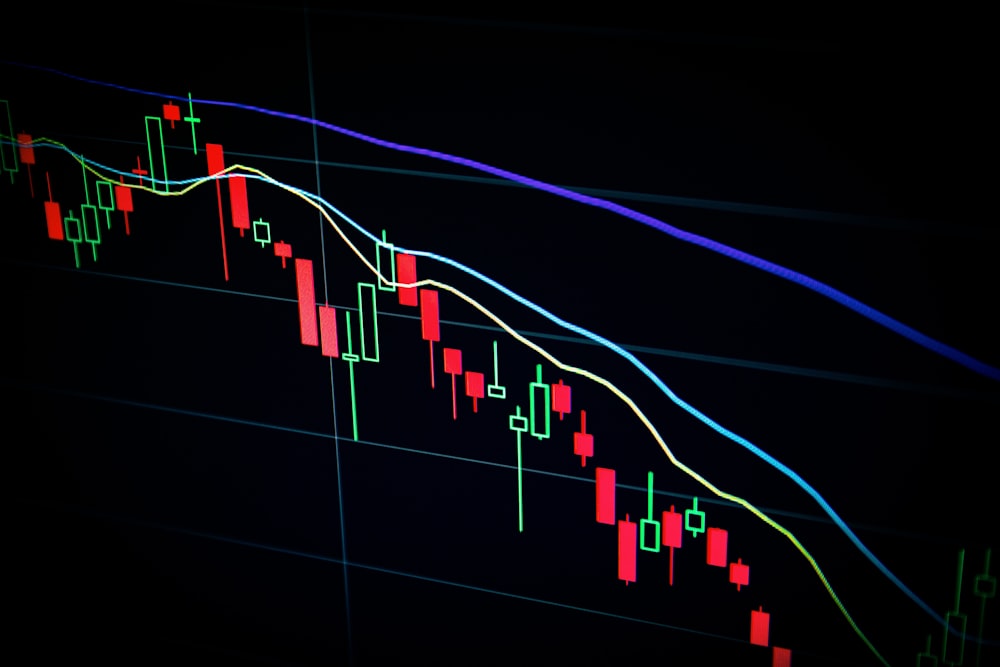
Module 1: Forex Trading Fundamentals
Welcome to the world's largest and most liquid financial market - the Foreign Exchange (Forex) market. With a daily trading volume exceeding $6 trillion, Forex dwarfs all other financial markets combined. In this comprehensive introduction, you'll learn the essential concepts that form the foundation of successful currency trading.
Key Insight: The 24-Hour Market
Unlike stock markets that operate during specific hours, Forex is open 24 hours a day, five days a week. This continuous operation across global financial centers creates unique trading opportunities but also requires disciplined risk management and strategic planning.
What Makes Forex Unique?
The Forex market has several distinctive characteristics that set it apart from other financial markets:
Key Forex Market Features
- High Liquidity: With $6+ trillion traded daily, you can enter and exit positions easily
- 24/5 Operation: Trade anytime from Sunday evening to Friday night
- Leverage Availability: Access to significant trading capital with small deposits
- Low Transaction Costs: Tight spreads and minimal commissions
- Two-Way Profit Potential: Profit from both rising and falling markets
- Global Accessibility: Trade from anywhere with an internet connection
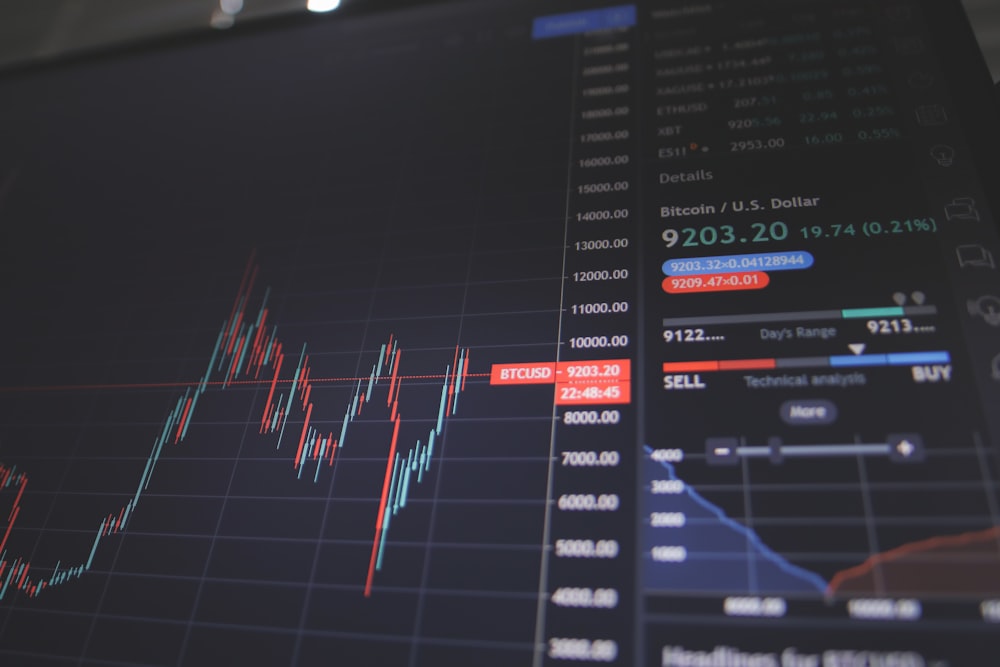
Chart: Global Forex trading volume by session - This chart shows trading activity across different time zones, with London session accounting for the highest volume at 35% of daily trades.
Real-World Trading Example
Let's examine a real trading scenario to understand how currency movements translate to profits and losses:
EUR/USD Trade Example
Situation: The European Central Bank announces stronger than expected economic data, suggesting potential interest rate hikes.
Trader Action: You buy EUR/USD at 1.0850, anticipating Euro strength against the US Dollar.
Outcome: The pair rises to 1.0950 over two days - a 100 pip move.
Profit Calculation: With a standard lot (100,000 units), each pip = $10. 100 pips × $10 = $1,000 profit.
This example shows how fundamental analysis combined with proper position sizing can lead to substantial returns.
Learning Tip: Start with a Demo Account
- Open a demo account with a reputable broker
- Practice placing trades without real money at risk
- Familiarize yourself with the trading platform interface
- Test different order types (market, limit, stop)
- Track your demo performance for at least one month before going live
Professional traders always test strategies in demo environments before risking real capital. This builds confidence and helps identify potential issues without financial consequences.
CURRENCY PAIRS
Understanding the building blocks
Beginner
Module 2: Currency Pairs and Market Structure
Currency pairs are the fundamental instruments of Forex trading. Every trade involves simultaneously buying one currency while selling another. Understanding how these pairs work, their relationships, and market structure is essential for developing effective trading strategies.
How Currency Pairs Work
In a currency pair like EUR/USD, the first currency (EUR) is the base currency, and the second (USD) is the quote currency. The exchange rate tells you how much of the quote currency you need to buy one unit of the base currency. If EUR/USD is 1.0850, you need 1.0850 US Dollars to buy 1 Euro.
Major Currency Pairs
The most traded pairs all include the US Dollar and account for the majority of Forex volume:
The Major Currency Pairs
- EUR/USD - Euro vs US Dollar (Most liquid, tightest spreads)
- USD/JPY - US Dollar vs Japanese Yen (High liquidity, carry trade favorite)
- GBP/USD - British Pound vs US Dollar (Volatile, news-driven)
- USD/CHF - US Dollar vs Swiss Franc (Safe-haven characteristics)
- AUD/USD - Australian Dollar vs US Dollar (Commodity-linked)
- USD/CAD - US Dollar vs Canadian Dollar (Oil correlation)
- NZD/USD - New Zealand Dollar vs US Dollar (Agricultural exports)
Chart: Currency pair correlation matrix - This visualization shows how different currency pairs move in relation to each other, helping traders avoid overexposure to correlated assets.
Real-World Trading Example: Cross Pairs
Cross pairs (pairs without USD) offer unique trading opportunities when major pairs are range-bound:
EUR/GBP Swing Trade Example
Situation: EUR/GBP has been trading in a tight range between 0.8550 and 0.8650 for three weeks.
Setup: Price breaks above 0.8650 resistance with increased volume.
Trade Entry: Buy EUR/GBP at 0.8660 with stop loss at 0.8580 (80 pips risk).
Target: Previous resistance at 0.8750 becomes support (90 pips potential profit).
Risk-Reward: 1:1.125 ratio - acceptable for a high-probability breakout trade.
This cross pair trade capitalized on relative strength between Euro and Pound without USD influence.
Learning Tip: Focus on 2-3 Pairs Initially
- Choose pairs that align with your trading schedule (session times)
- Research the economic drivers for your selected pairs
- Track correlation between your chosen pairs to avoid overexposure
- Study historical volatility patterns for each pair
- Master your selected pairs before expanding to others
Professional traders often specialize in a few currency pairs rather than trading everything. Deep knowledge of specific pairs leads to better trading decisions and improved performance.
MARKET SESSIONS
Trading the global clock
Beginner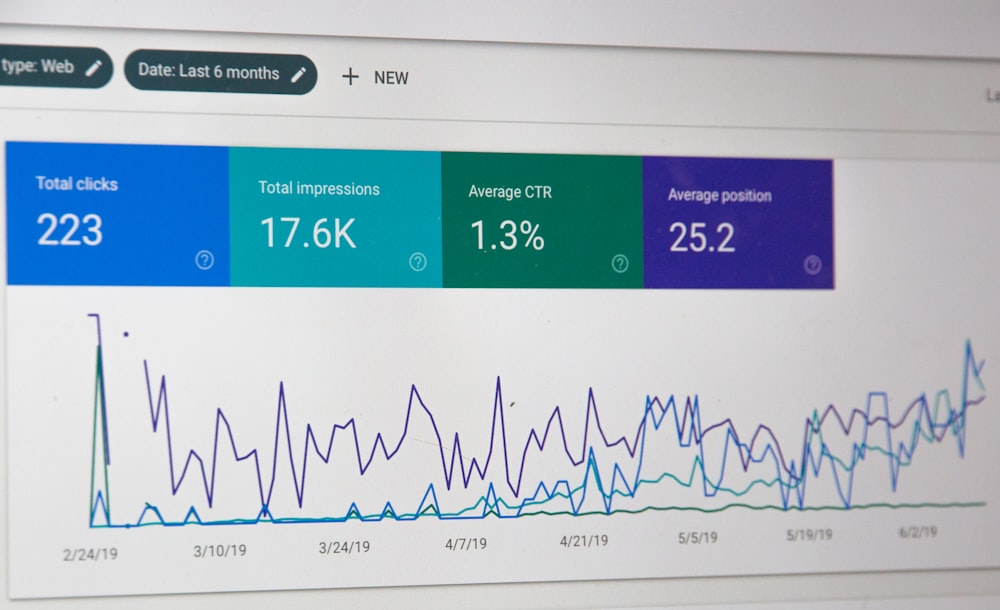
Module 3: Global Market Sessions and Volatility
The Forex market operates 24 hours a day as trading passes through major financial centers worldwide. Understanding these sessions - their characteristics, overlaps, and volatility patterns - is crucial for timing your trades effectively and maximizing profit potential while managing risk.
The Three Major Trading Sessions
Forex trading follows the sun across three primary sessions: Asian (Tokyo), European (London), and North American (New York). Each session has distinct volatility characteristics, currency focus, and trading opportunities that professional traders learn to exploit.
Session Characteristics and Strategies
Each trading session offers unique opportunities based on market participants and economic activity:
Trading Session Breakdown
- Asian Session (Tokyo): 11 PM - 8 AM GMT
- Lower volatility, range-bound trading
- Focus on JPY pairs and Asian currencies
- Ideal for position traders and range strategies
- European Session (London): 7 AM - 4 PM GMT
- Highest volatility, major trend movements
- Focus on EUR, GBP, and CHF pairs
- Best for breakout and momentum strategies
- US Session (New York): 12 PM - 8 PM GMT
- High volatility, especially during overlap
- Focus on USD pairs and news reactions
- Excellent for day trading and news strategies

Chart: Daily volatility by trading session - This real trading chart shows EUR/USD volatility patterns across different sessions, with the London session showing the highest average pip movement and the Asian session the lowest.
Real-World Trading Example: London Breakout
Professional traders often focus on the London session for high-probability breakout opportunities:
GBP/USD London Session Breakout
Session: London Open (7 AM GMT)
Situation: GBP/USD has consolidated overnight between 1.2650-1.2700 during Asian session.
Setup: London liquidity enters the market, creating increased volume.
Breakout: Price breaks above 1.2700 resistance in first hour of London session.
Trade Entry: Buy stop order triggered at 1.2705.
Stop Loss: Below consolidation at 1.2675 (30 pips risk).
Target: Previous daily high at 1.2775 (70 pips profit potential).
Result: Trade hits target by New York open for 2.33 risk-reward ratio.
This strategy capitalizes on increased volatility at London open to capture early directional moves.
Learning Tip: Trade During Session Overlaps
- London-New York overlap (12 PM - 4 PM GMT) offers highest volatility
- Asian-London overlap (7 AM - 8 AM GMT) provides early European direction
- Adjust your strategy based on session characteristics
- Use lower timeframes during high volatility periods
- Avoid trading during session transitions when liquidity drops
Session overlaps create the most trading opportunities due to increased participation from multiple financial centers. Focus your active trading during these windows for optimal results.
CHART READING
Mastering price action analysis
Intermediate
Module 4: Reading Charts and Candlestick Patterns
Charts are the trader's window into market psychology. Learning to read price action through candlestick patterns, chart formations, and market structure provides the foundation for all technical analysis. This module will transform how you see and interpret market movements.
The Building Blocks: Candlesticks
Each candlestick tells a story about the battle between bulls and bears during a specific time period. The body shows the opening and closing price, while the wicks (shadows) reveal the high and low. The color (typically green/red) indicates whether the close was higher or lower than the open.
Essential Candlestick Patterns
Professional traders recognize specific candlestick formations that signal potential market reversals or continuations:
High-Probability Candlestick Patterns
- Bullish Engulfing: Large green candle completely engulfs previous red candle - signals potential reversal upward
- Bearish Engulfing: Large red candle completely engulfs previous green candle - signals potential reversal downward
- Hammer: Small body with long lower wick at bottom of downtrend - bullish reversal signal
- Shooting Star: Small body with long upper wick at top of uptrend - bearish reversal signal
- Doji: Opening and closing prices are virtually equal - indicates market indecision
- Morning Star: Three-candle pattern signaling bullish reversal after downtrend
- Evening Star: Three-candle pattern signaling bearish reversal after uptrend

Chart: Candlestick pattern recognition - This real trading chart shows various candlestick patterns including bullish engulfing, hammers, and dojis that signaled important market turning points on EUR/USD.
Real-World Trading Example: Hammer Reversal
Candlestick patterns combined with support/resistance levels create high-probability trading setups:
USD/JPY Hammer Reversal Trade
Timeframe: Daily chart
Situation: USD/JPY has declined for seven consecutive days, approaching major support at 148.50.
Pattern: A hammer candlestick forms exactly at the 148.50 support level.
Confirmation: Next candle is a strong green candle closing above hammer high.
Trade Entry: Buy USD/JPY at 149.20 (above hammer confirmation).
Stop Loss: Below hammer low at 148.30 (90 pips risk).
Target: Previous resistance at 151.50 (230 pips profit potential).
Psychology: Hammer shows sellers exhausted at support, buyers stepping in aggressively.
This trade combines candlestick analysis with key support for a high-probability reversal setup with 2.55 risk-reward ratio.
Learning Tip: Practice Pattern Recognition
- Study historical charts to identify common patterns
- Focus on patterns that form at key support/resistance levels
- Use higher timeframes (4H, Daily) for more reliable signals
- Wait for confirmation candle before entering trades
- Combine candlestick patterns with other technical tools
Pattern recognition becomes intuitive with practice. Start by identifying just 2-3 high-probability patterns and master them before expanding your repertoire. Quality over quantity leads to better trading decisions.
SUPPORT & RESISTANCE
Identifying key market levels
Intermediate
Module 5: Support, Resistance, and Trendlines
Support and resistance form the foundation of technical analysis. These key price levels represent areas where buying and selling pressure have historically created market turning points. Mastering their identification and application will significantly improve your trading accuracy and timing.
The Psychology Behind Support & Resistance
Support forms when buyers outnumber sellers, preventing further price declines. Resistance occurs when sellers overwhelm buyers, halting upward moves. These levels represent collective market memory where traders previously took action, creating self-fulfilling prophecies as price approaches them again.
Types of Support and Resistance
Professional traders identify multiple types of support/resistance for comprehensive market analysis:
Key Support/Resistance Categories
- Static Horizontal Levels: Previous swing highs/lows that price has reacted to multiple times
- Dynamic Trendlines: Diagonal lines connecting successive highs (resistance) or lows (support)
- Moving Averages: Dynamic support/resistance that changes with price
- Fibonacci Levels: Mathematical ratios derived from significant price moves
- Psychological Levels: Round numbers (1.1000, 1.5000) that attract trader attention
- Volume Profile: Areas where significant trading volume occurred previously

Chart: Multiple support and resistance levels - This real GBP/USD chart shows how price respects key horizontal levels, with previous resistance becoming new support after breaks (role reversal).
Real-World Trading Example: Bounce Trade
Trading bounces at key support/resistance levels offers excellent risk-reward opportunities:
EUR/USD Support Bounce Trade
Level Identification: EUR/USD has bounced three times from 1.0720-1.0750 area over past two months.
Current Situation: Price approaches this established support zone again.
Confirmation: Bullish engulfing pattern forms at 1.0735 within support zone.
Trade Entry: Buy EUR/USD at 1.0740 with stop loss below support at 1.0690 (50 pips risk).
Target: Previous resistance at 1.0850 (110 pips profit potential).
Risk-Reward: 1:2.2 ratio - favorable for support bounce trade.
Market Psychology: Buyers defending established level, creating potential for strong bounce.
This trade capitalizes on historical price behavior at a proven support level with clearly defined risk parameters.
Learning Tip: Map Key Levels on Multiple Timeframes
- Identify support/resistance on weekly and daily charts first
- Mark these levels on your trading timeframe (1H, 4H)
- Note which levels have been tested multiple times
- Watch for role reversal (resistance becomes support and vice versa)
- Give more weight to levels that align across multiple timeframes
The most powerful support/resistance levels are those that appear across multiple timeframes. These confluence areas offer the highest probability trading opportunities with favorable risk-reward ratios.
TECHNICAL INDICATORS
Using tools to confirm trading signals
Intermediate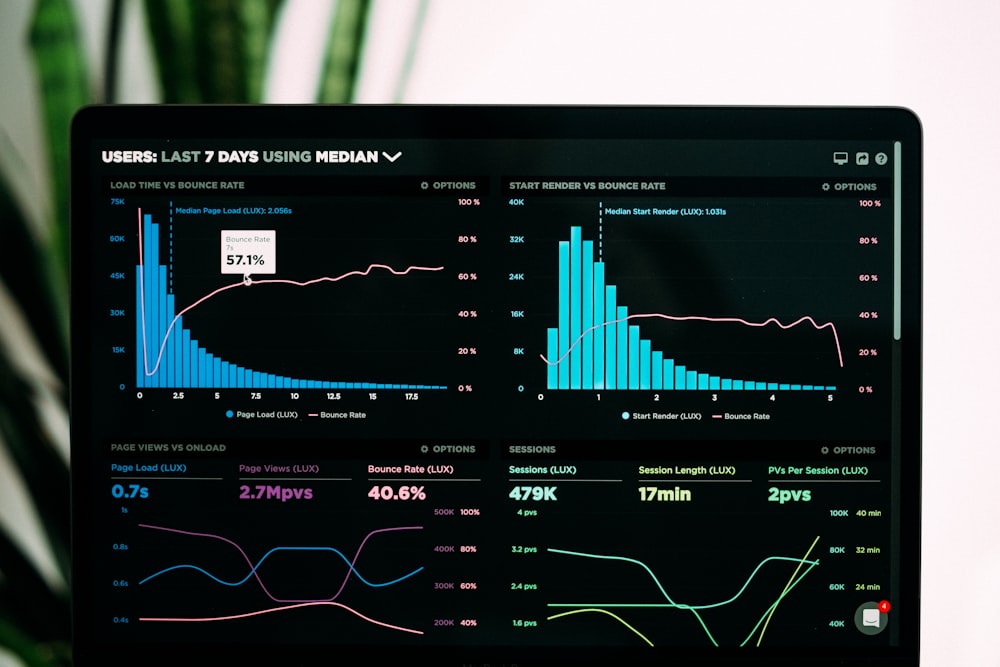
Module 6: Technical Indicators and Oscillators
Technical indicators help traders confirm price action signals, identify trends, and spot potential reversals. This module covers the most effective indicators including RSI, MACD, Moving Averages, and Bollinger Bands, with real-world application examples.
Indicator Categories and Applications
Technical indicators fall into three main categories: trend-following (identify direction), momentum (measure speed), and volatility (measure price fluctuations). Professional traders use complementary indicators from different categories to confirm signals.
Essential Technical Indicators
Master these core indicators that form the foundation of technical analysis:
Key Technical Indicators
- RSI (Relative Strength Index): Momentum oscillator measuring speed and change of price movements (range: 0-100)
- MACD (Moving Average Convergence Divergence): Trend-following momentum indicator showing relationship between two moving averages
- Moving Averages: Smooth out price data to identify trend direction (Simple, Exponential, Weighted)
- Bollinger Bands: Volatility bands placed above and below a moving average
- Stochastic Oscillator: Momentum indicator comparing closing price to price range over time
- Fibonacci Retracement: Identify potential reversal levels based on mathematical ratios

Chart: Multi-indicator trading setup - This EUR/USD chart shows RSI, MACD, and moving averages working together to confirm trend direction and identify potential entry points.
Real-World Trading Example: RSI Divergence
Indicator divergences often signal potential trend reversals before price action confirms them:
GBP/USD RSI Divergence Trade
Setup: GBP/USD makes new high at 1.2800, but RSI shows lower high (bearish divergence).
Confirmation: Price breaks below recent swing low at 1.2750.
Trade Entry: Sell GBP/USD at 1.2745 with stop loss above divergence high at 1.2820 (75 pips risk).
Target: Previous support at 1.2650 (95 pips profit potential).
Indicator Logic: RSI divergence indicates weakening momentum despite higher prices.
Result: Price declines to target over three days for 1:1.27 risk-reward ratio.
This trade demonstrates how indicator divergences can provide early warning of potential trend changes.
Learning Tip: Less is More with Indicators
- Avoid indicator overload - use 2-3 complementary indicators maximum
- Combine trend-following with momentum indicators for confirmation
- Use higher timeframe indicators for direction, lower for timing
- Understand what each indicator measures and its limitations
- Backtest indicator settings for your specific trading style
Professional traders use indicators to confirm price action, not replace it. Too many indicators create conflicting signals and analysis paralysis. Focus on mastering a few reliable indicators rather than using many poorly understood ones.
FUNDAMENTAL ANALYSIS
Understanding what moves currency markets
Intermediate
Module 7: Fundamental Analysis and Economic Drivers
While technical analysis shows you WHEN to trade, fundamental analysis tells you WHY currencies move. Central bank policies, economic data releases, and geopolitical events create the trends that technical traders profit from. This module teaches you to interpret economic data and anticipate market-moving events.
The Drivers Behind Currency Movements
Currencies reflect the economic health of their respective countries. Strong economies with rising interest rates typically see currency appreciation, while weak economies with falling rates experience depreciation. Understanding these relationships is crucial for long-term trading success.
Key Fundamental Drivers
Professional traders monitor these economic indicators to anticipate currency movements:
Essential Economic Indicators
- Interest Rates: The single most important driver of currency valuations
- Inflation (CPI): Determines central bank monetary policy decisions
- Employment Data: Non-Farm Payrolls (US) and unemployment rates
- GDP Growth: Measures overall economic health and expansion
- Central Bank Communications: Speeches, minutes, and forward guidance
- Trade Balance: Difference between exports and imports
- Political Events: Elections, policy changes, and geopolitical tensions

Chart: Economic calendar with high-impact events - This professional trading calendar shows upcoming economic releases color-coded by potential market impact, helping traders prepare for volatility.
Real-World Trading Example: NFP Reaction
The Non-Farm Payrolls report is one of the most market-moving economic releases:
USD/JPY NFP Trade
Event: US Non-Farm Payrolls report
Expectation: 180,000 jobs added
Actual: 350,000 jobs added (significantly higher)
Market Reaction: USD strengthens on Fed rate hike expectations
Trade Setup: Pre-set sell stop orders below pre-NFP range at 148.20
Entry: Order fills at 148.15 as USD/JPY breaks down
Stop Loss: Above pre-NFP range at 149.00 (85 pips risk)
Target: Previous support at 147.00 (115 pips profit)
Result: Trade hits target within hours for 1:1.35 risk-reward ratio
This trade demonstrates how prepared traders can capitalize on economic news volatility with predefined risk parameters.
Learning Tip: Trade the Reaction, Not the News
- Never try to predict news outcomes - the market is unpredictable
- Prepare for multiple scenarios with predefined entry orders
- Use wider stops during high-volatility news events
- Scale out partial profits quickly on initial spikes
- Let remaining position run if trend continuation occurs
- Always know when major economic releases are scheduled
The initial reaction to news often reverses, so professional traders focus on the sustained move that follows rather than the immediate spike. Having a plan for different outcomes removes emotion from news trading.
PRICE ACTION
Reading the pure language of markets
Intermediate
Module 8: Price Action and Market Structure
Price action trading focuses on analyzing raw price movement without relying heavily on indicators. It's based on the premise that price reflects all available information and market sentiment. By understanding market structure - highs, lows, and swing points - you can anticipate future price movements with remarkable accuracy.
The Essence of Price Action Trading
Price action is the foundation of all technical analysis. While indicators are derived from price, price action analyzes the source itself. This pure approach eliminates lag and provides real-time insights into market sentiment and potential future direction.
Key Price Action Concepts
Master these essential price action concepts to read market structure like a professional:
Core Price Action Principles
- Market Structure: The arrangement of swing highs and lows that define trend direction
- Supply and Demand Zones: Areas where significant buying or selling previously occurred
- Order Blocks: Candles that initiated strong moves, often becoming future support/resistance
- Liquidity Pools: Areas where stops are likely clustered, often targeted by large players
- Fair Value Gaps: Imbalances between buying and selling that often get filled
- Break of Structure (BOS): When price conclusively breaks previous significant levels
- Change of Character (CHOCH): Shifts in market behavior indicating potential trend changes
Chart: Market structure analysis - This advanced price action chart shows clear swing points, break of structure (BOS) signals, and liquidity pools that professional traders use to identify high-probability entries.
Real-World Trading Example: Break of Structure
Break of structure (BOS) signals provide high-probability trend continuation entries:
EUR/USD BOS Trade
Market Structure: EUR/USD in clear uptrend with higher highs and higher lows
Pullback: Price retraces to previous resistance turned support at 1.0950
BOS Signal: Price breaks above most recent high at 1.1020
Trade Entry: Buy EUR/USD at 1.1025 on BOS confirmation
Stop Loss: Below swing low at 1.0980 (45 pips risk)
Target: Measured move to 1.1120 (95 pips profit potential)
Market Psychology: Break of structure confirms buyers still in control, trend likely to continue
Result: Price advances to target over three days for 1:2.1 risk-reward ratio
This trade demonstrates how clean market structure analysis provides clear entry signals with defined risk parameters.
Learning Tip: Trade with the Higher Timeframe Trend
- Always identify the dominant trend on daily/weekly charts first
- Only take long setups in uptrends, short setups in downtrends
- Use lower timeframes for precise entry timing within the larger trend
- Align your trades with institutional flow (follow the smart money)
- Avoid counter-trend trading until you have significant experience
The trend is your friend - this classic trading wisdom holds true for price action traders. Trading with the higher timeframe trend significantly increases your probability of success and helps you avoid dangerous counter-trend setups.
RISK MANAGEMENT
The foundation of trading success
Intermediate
Module 9: Risk and Money Management Principles
Risk management isn't just a component of trading - it's the foundation upon which all successful trading careers are built. Proper position sizing and risk control ensure you survive losing streaks and remain in the game long enough to achieve profitability. This module teaches the mathematical principles that separate professionals from gamblers.
The Golden Rule: Preserve Capital
"The first rule of trading is don't lose money. The second rule is don't forget the first rule." - Warren Buffett (adapted for trading). Your primary goal as a trader should be capital preservation, not aggressive growth. Consistent small gains compound into significant wealth over time.
The Mathematics of Trading Survival
Understanding these mathematical concepts is crucial for long-term trading success:
Essential Risk Management Concepts
- The 1% Rule: Never risk more than 1% of your account on a single trade
- Risk-Reward Ratio: Always maintain minimum 1:2 risk-reward ratio
- Position Sizing: Calculate lot size based on stop loss distance and account risk
- Correlation Analysis: Avoid overexposure to correlated currency pairs
- Drawdown Limits: Pre-defined maximum loss thresholds (e.g., 10% monthly maximum)
- Risk of Ruin: Mathematical probability of blowing your account
- Compounding Plans: Systematic account growth strategies

Chart: Position sizing calculation example - This visual calculator shows how to determine exact lot size based on account balance, risk percentage, stop loss distance, and currency pair specifications.
Real-World Example: The 1% Rule in Action
Proper position sizing protects your account during inevitable losing streaks:
Risk Management Calculation
Account Balance: $10,000
Risk per Trade: 1% ($100)
Trade Setup: EUR/USD with 50 pip stop loss
Position Size Calculation: $100 ÷ 50 pips = $2 per pip
Micro Lots: 20 micro lots (each = $0.10 per pip)
Scenario: 10 consecutive losses
Account Impact: -$1,000 (10% drawdown) - still $9,000 to recover
Without 1% Rule: Risking 5% per trade would result in -50% drawdown ($5,000 loss)
This example demonstrates how proper risk management prevents catastrophic losses and preserves trading capital during difficult periods.
Learning Tip: Risk Management Before Entry
- Always calculate position size and set stop loss BEFORE entering any trade
- Use a position size calculator or create a spreadsheet template
- Never move stop losses further away from entry to avoid losses
- Reduce position size during losing streaks to protect capital
- Keep total account risk below 5% at all times (across all positions)
- Regularly review and adjust risk parameters as account grows
Risk management should be automated and non-negotiable. By calculating your risk before every trade, you remove emotion from the process and ensure consistent application of your risk parameters regardless of market conditions.
SCALPING STRATEGIES
Capturing small, frequent profits
Advanced
Module 10: Scalping Techniques for Fast Markets
Scalping involves taking numerous small profits throughout the trading day, typically holding positions for seconds to minutes. This strategy requires intense focus, quick decision-making, and disciplined execution. Scalpers capitalize on small price movements during high-volatility periods, often trading during London and New York session overlaps.
The Art of High-Frequency Trading
Scalping is not for everyone. It requires lightning-fast execution, emotional control, and the ability to make split-second decisions. Successful scalpers often have backgrounds in competitive fields that require quick thinking and rapid pattern recognition.
Essential Scalping Techniques
Master these core scalping methods used by professional day traders:
Professional Scalping Methods
- Timeframe Selection: Use 1-minute to 15-minute charts for entry timing
- Session Focus: Trade only during high-volume sessions (London, New York)
- Pair Selection: Focus on major pairs with tightest spreads (EUR/USD, USD/JPY)
- Execution Speed: Use market orders for immediate entry and exit
- Profit Targets: Aim for 5-15 pips per trade with tight stops
- Volume Analysis: Only trade setups with confirmed volume increases
- Multiple Positions: Scale in and out of positions for optimal risk management
Chart: Scalping setup on 1-minute EUR/USD - This fast-moving chart shows multiple scalping entries and exits within a 30-minute period during London session, with tight stops and quick profit targets.
Real-World Trading Example: London Session Scalping
Professional scalpers focus on the London session for optimal liquidity and volatility:
EUR/USD Scalping Session
Session: London Open (7 AM GMT)
Instrument: EUR/USD on 1-minute chart
Strategy: Breakout scalping with 5 pip stops, 8 pip targets
Trade 1: Break above minor resistance at 1.0885, enter long at 1.0887
Result: Hit 8 pip target at 1.0895 within 3 minutes (1:1.6 risk-reward)
Trade 2: Pullback to 1.0880 support, enter long at 1.0882
Result: Hit 8 pip target at 1.0890 within 2 minutes (1:1.6 risk-reward)
Trade 3: Break below 1.0878 support, enter short at 1.0876
Result: Hit 8 pip target at 1.0868 within 4 minutes (1:1.6 risk-reward)
Session Total: 3 trades, 24 pips profit, controlled risk throughout
This scalping session demonstrates how focused execution during high-volatility periods can generate consistent small profits with controlled risk.
Learning Tip: Master One Session First
- Don't try to scalp throughout the entire trading day
- Start by focusing on just one high-volatility session (London or New York open)
- Master the patterns and rhythm of that specific session
- Gradually expand to other time windows as you gain experience
- Take regular breaks to maintain mental clarity and focus
- Track your performance metrics for continuous improvement
Scalping requires intense mental focus that diminishes over time. Professional scalpers typically trade in focused 2-3 hour sessions rather than throughout the entire day. This focused approach leads to better results than spreading yourself too thin across multiple sessions.
SWING TRADING
Capturing multi-day market moves
Advanced
Module 11: Swing Trading Strategies and Techniques
Swing trading involves holding positions for several days to weeks, capturing the "meat" of price moves while avoiding the noise of intraday fluctuations. This approach requires patience, strong analytical skills, and the ability to withstand temporary drawdowns while waiting for targets to be reached. Swing traders typically use daily and 4-hour charts for analysis.
The Patient Trader's Approach
Swing trading strikes an optimal balance between the rapid pace of day trading and the long timeframes of position trading. It allows traders to capture significant market moves without requiring constant screen monitoring. This approach is ideal for those with full-time jobs or other commitments.
Swing Trading Methodology
Professional swing traders follow this systematic approach:
Swing Trading Framework
- Timeframe Alignment: Use daily charts for direction, 4-hour for setup, 1-hour for entry
- Trend Identification: Trade in the direction of the dominant higher timeframe trend
- Pullback Entries: Enter during counter-trend moves within the larger trend
- Multiple Targets: Scale out profits at logical resistance levels
- Trailing Stops: Protect profits while allowing room for trend continuation
- Weekend Analysis: Use non-trading time for comprehensive market analysis
- Position Sizing: Larger positions than day trading but with wider stops
Chart: Multi-timeframe swing trading analysis - This comprehensive chart shows a complete swing trading setup across daily, 4-hour, and 1-hour timeframes, with clear entry, multiple profit targets, and trailing stop methodology.
Real-World Trading Example: GBP/USD Swing Trade
Swing traders capture significant moves by entering during pullbacks within larger trends:
GBP/USD Multi-Day Swing Trade
Trend Analysis: GBP/USD in clear uptrend on daily chart
Pullback Setup: Price retraces to key support at 1.2650 after strong advance
Entry Signal: Bullish engulfing pattern forms at support on daily chart
Trade Entry: Buy GBP/USD at 1.2660 on daily close above engulfing pattern
Stop Loss: Below swing low at 1.2580 (80 pips risk)
Target 1: Previous resistance at 1.2780 (120 pips profit)
Target 2: Measured move extension at 1.2880 (additional 100 pips)
Trade Management: Scale out 50% at Target 1, trail stop to breakeven
Result: First target hit in 3 days, second target hit 2 days later
Total Profit: 220 pips with 80 pip risk (1:2.75 ratio)
This swing trade demonstrates how patient entries during pullbacks within larger trends can yield excellent risk-reward ratios with controlled risk.
Learning Tip: Weekend Analysis for Weekly Planning
- Use weekends to analyze weekly and daily charts without market pressure
- Identify key support/resistance levels for the coming week
- Determine overall trend direction on higher timeframes
- Mark potential setup zones where you'll look for entries
- Review economic calendar for upcoming market-moving events
- Update your watchlist and remove instruments that no longer meet criteria
Weekend preparation is crucial for swing traders. This pre-planned approach reduces emotional decision-making during the trading week and improves trade quality. By knowing your levels and setups in advance, you can execute with confidence when opportunities arise.
BREAKOUT TRADING
Riding strong directional moves
Advanced
Module 12: Breakout and Trend-Following Strategies
Breakout trading involves entering when price moves beyond defined support or resistance levels, anticipating continued momentum in the breakout direction. Trend-following strategies aim to capture the majority of established trends by entering pullbacks within the larger trend. Both approaches capitalize on strong directional moves for maximum profit potential.
Capitalizing on Market Momentum
Breakout traders thrive on volatility and strong directional moves. While many traders fear breakouts due to potential false signals, professional breakout traders have specific techniques to filter out false breakouts and capitalize on genuine momentum shifts.
Breakout Trading Techniques
Master these professional breakout trading methods:
Advanced Breakout Strategies
- Consolidation Breakouts: Trade breaks from prolonged ranging periods
- Chart Pattern Breakouts: Triangle, rectangle, and flag pattern breakouts
- False Breakout Entries: Enter in the original direction after failed breakouts
- Volume Confirmation: Only trade breakouts supported by increased volume
- Retest Entries: Wait for price to retest the breakout level for higher probability
- Multiple Timeframe Confirmation: Ensure breakout aligns across timeframes
- Volatility Expansion: Trade breakouts that occur with expanding volatility
Chart: Breakout and retest pattern - This real trading chart shows a classic breakout and retest scenario where price breaks above resistance, pulls back to retest that level (now support), then continues higher in a strong trend.
Real-World Trading Example: EUR/USD Breakout
Breakout traders use pending orders to capture moves as they occur:
EUR/USD Range Breakout Trade
Market Condition: EUR/USD consolidating between 1.0950-1.1050 for three weeks
Breakout Preparation: Set buy stop above resistance at 1.1055, sell stop below support at 1.0945
Breakout Trigger: Price breaks above 1.1050 with increased volume
Trade Entry: Buy stop order fills at 1.1055
Stop Loss: Below consolidation range at 1.1020 (35 pips risk)
Target: Measured move based on range height: 1.1150 (95 pips profit potential)
Trade Management: Trail stop to breakeven once +50 pips in profit
Result: Price rallies to target over two days for 1:2.71 risk-reward ratio
Alternative Scenario: If false breakout occurred, sell stop would capture move downward
This breakout strategy demonstrates how prepared traders can capitalize on range breakouts in either direction with predefined risk parameters.
Learning Tip: Trade with the Institutional Flow
- Pay attention to where stops are likely clustered (beyond obvious levels)
- These liquidity pools are often targeted by large players
- Position your entries to benefit from these institutional moves
- Avoid placing stops at obvious levels where they can be hunted
- Use mental stops or place stops beyond liquidity concentrations
- Understand that false breakouts often precede genuine moves
Professional traders understand that markets are driven by institutional order flow. By understanding where liquidity resides and how large players operate, you can position yourself to benefit from their moves rather than falling victim to stop hunts and false breakouts.
TRADING PSYCHOLOGY
Mastering your mind for consistency
Advanced
Module 13: Trading Psychology and Emotional Discipline
Trading psychology is often cited as the most important factor in determining long-term success. While strategies and analysis provide the roadmap, psychology determines whether you'll follow it consistently. Professional traders approach the market with discipline, patience, and emotional detachment. This module will transform your mindset and emotional resilience.
The 80/20 Rule of Trading
Approximately 80% of trading success comes from psychology and risk management, while only 20% comes from your actual trading strategy. Focus on mastering your mind, and the profits will follow. The markets will always be here - your job is to ensure you're still here to trade them.
The Mental Game of Trading
Professional traders cultivate these psychological attributes:
The 5 Pillars of Trading Psychology
- Discipline - Following your trading plan without exception
- Patience - Waiting for high-probability setups instead of forcing trades
- Objectivity - Removing emotion from trading decisions
- Resilience - Bouncing back from losses without emotional damage
- Consistency - Applying your edge repeatedly over time
Chart: Trader psychology cycle - This visual illustrates the emotional cycle traders experience - from optimism during winning streaks to despair during drawdowns - and how professional traders maintain equilibrium through all market conditions.
Real-World Example: Overcoming a Losing Streak
How professional traders handle inevitable losing periods:
Managing a Drawdown Period
Situation: Trader experiences 5 consecutive losses, totaling -3% of account
Amateur Response: Revenge trading, increasing position size, abandoning plan
Professional Response: Stick to 1% risk rule, take day off to reset mentally
Mental Reset: Review trading journal, ensure following plan correctly
Return Strategy: Resume with reduced position size (0.5% risk)
Outcome: Next 7 trades are winners, recovering drawdown plus profit
Key Insight: Losing streaks are normal - survival is what matters
Psychological Win: Maintaining discipline during adversity builds confidence
This scenario demonstrates how disciplined risk management and emotional control during difficult periods separate professionals from amateurs.
Learning Tip: Develop a Pre-Trade Ritual
- Create a consistent routine before each trading session
- Review your trading plan and risk parameters
- Check economic calendar for upcoming events
- Set up charts and mark key support/resistance levels
- Perform brief meditation or breathing exercises to center yourself
- Mentally rehearse executing your plan flawlessly
- Visualize handling both winning and losing trades with equanimity
Your pre-trade ritual puts you in the optimal mindset for disciplined trading. The routine itself becomes a psychological trigger for focused, professional trading behavior. This consistency helps override emotional impulses and maintains trading discipline through all market conditions.
TRADING PLAN
Your roadmap to consistency
Advanced
Module 14: Building a Consistent Trading Plan
A trading plan is your personal rulebook that guides every aspect of your trading. It removes emotion from decision-making and provides a framework for consistent execution. Without a plan, you're simply gambling. With a plan, you're running a business. This module will help you create a comprehensive trading plan tailored to your personality, goals, and risk tolerance.
Your Personal Trading Constitution
Your trading plan should be so specific that another trader could execute it exactly as you would. It must cover every possible scenario and leave no room for interpretation. When in doubt, your plan provides the answer - not your emotions in the heat of the moment.
Essential Components of a Trading Plan
A professional trading plan includes these non-negotiable elements:
Trading Plan Framework
- Markets & Instruments: Which currency pairs you will trade
- Trading Timeframes: Which charts you'll use for analysis and execution
- Session Preferences: When you'll be actively trading
- Entry Criteria: Specific conditions that must be met before entering
- Exit Rules: Clear guidelines for stop losses and profit targets
- Risk Management: Position sizing and maximum risk parameters
- Trade Management: How you'll manage open positions
- Performance Tracking: How you'll measure and review your results
- Plan Review Schedule: When you'll evaluate and update your plan
Chart: Complete trading plan template - This comprehensive template shows all essential components of a professional trading plan, with specific, actionable rules for every aspect of your trading business.
Real-World Example: Complete Trading Plan Framework
Here's what a professional trading plan looks like in practice:
Sample Trading Plan
Markets: EUR/USD and GBP/USD only
Timeframes: Daily for direction, 4H for setups, 1H for entries
Sessions: London session only (7 AM - 4 PM GMT)
Risk Management: 1% risk per trade, maximum 3% daily risk
Entry Criteria: Must have minimum 1:2 risk-reward ratio, confluence of 2+ technical factors
Stop Loss: Always set immediately upon entry, never moved away from price
Profit Taking: Scale out 50% at 1R, trail stop on remainder
Maximum Trades: 3 trades per day maximum
Stop Trading: After 2 consecutive losses or 3% daily drawdown
Review Schedule: Weekly performance review every Sunday
Plan Updates: Quarterly review and adjustment based on performance data
This specific, measurable plan creates consistency and eliminates ambiguity in trading decisions. Notice how every aspect is clearly defined with no room for interpretation.
Learning Tip: Start Simple and Refine Over Time
- Begin with a basic trading plan focusing on 1-2 currency pairs
- Test your plan in demo for at least 2-3 months
- Track every trade and review performance metrics weekly
- Identify what's working and what isn't through data analysis
- Refine your plan based on actual performance, not theory
- Gradually add complexity only when simpler version is mastered
- Remember: A simple plan executed consistently outperforms a complex plan executed poorly
Your trading plan is a living document that should evolve as you gain experience. The goal isn't to create the perfect plan immediately, but to create a good enough plan that you can execute consistently while collecting data to make informed improvements over time.
COMMON MISTAKES
Avoiding costly trading errors
Advanced
Module 15: Common Trading Mistakes and How to Avoid Them
Even experienced traders make mistakes, but professionals learn to recognize and avoid the most common pitfalls that destroy trading accounts. This final module identifies these critical errors and provides practical strategies to avoid them. By learning from others' mistakes, you can accelerate your journey to consistent profitability.
The Path to Mastery
Trading mastery isn't about never making mistakes - it's about recognizing them quickly, learning from them, and avoiding repetition. The most successful traders are those who've made every mistake in the book but developed systems to prevent recurrence.
Most Common Trading Mistakes
Be aware of these account-destroying errors and how to avoid them:
Top 10 Trading Mistakes
- No Trading Plan: Trading without a defined system or rules
- Poor Risk Management: Risking too much per trade or overall
- Revenge Trading: Trying to immediately recover losses emotionally
- Overleveraging: Using excessive leverage that amplifies losses
- Moving Stop Losses: Widening stops to avoid taking losses
- FOMO Trading: Entering trades late due to fear of missing out
- Overtrading: Taking low-quality setups out of boredom
- Lack of Patience: Not waiting for high-probability setups
- Ignoring Fundamentals: Trading against major economic trends
- No Performance Review: Not tracking or analyzing trading results
Chart: Trading mistake analysis - This visual breakdown shows the most common trading errors and their impact on account performance, with practical solutions for each problem area.
Real-World Example: Revenge Trading Recovery
How to recover when you've fallen into common trading traps:
Bouncing Back from Trading Errors
Mistake Made: Revenge trading after 3 consecutive losses
Result: Additional 4 losses, total drawdown of -7%
Recognition: Realized emotional trading was destroying account
Immediate Action: Stopped trading completely for 48 hours
Mental Reset: Reviewed trading journal, identified emotional triggers
System Adjustment: Added "stop trading after 2 losses" rule to plan
Return Strategy: Resumed with 0.5% risk until confidence restored
Long-term Solution: Implemented mandatory trading breaks after losses
Outcome: Returned to profitability within 2 weeks, stronger mentally
This recovery process demonstrates that mistakes themselves aren't fatal - it's how you respond that determines long-term success.
Learning Tip: Create a Mistake Prevention Checklist
- Review your most common trading mistakes regularly
- Create a pre-trade checklist that addresses these specific errors
- Include questions like "Am I following my plan?" and "Is this revenge trading?"
- Keep the checklist visible during trading sessions
- Review it before entering every single trade
- Update it as you identify new potential pitfalls
- Share it with a trading partner for accountability
A mistake prevention checklist transforms abstract awareness into concrete action. By systematically reviewing potential errors before each trade, you dramatically reduce the likelihood of repeating them. This simple habit can save your account from costly mistakes and accelerate your progress toward consistency.
Your Journey to Consistent Profitability
Congratulations on completing the SkillMynte Forex Trading Masterclass! You now possess the knowledge, strategies, and mindset needed for long-term trading success. Remember that trading is a marathon, not a sprint. Consistent profitability comes from applying these principles day after day, month after month.
Trust your plan, manage your risk, control your emotions, and focus on the process rather than individual trade outcomes. The markets will always be here - your job is to ensure you're still here to trade them. Continue learning, stay disciplined, and may your trading journey be profitable and fulfilling.